 ImaraISP
Reports
The weekly numbers an owner asks for, what each tile shows, and how to export them
Reports answers four questions: how much came in, how much is still owed, who renewed on time, and who left. Everything is filtered by one time range and one site.
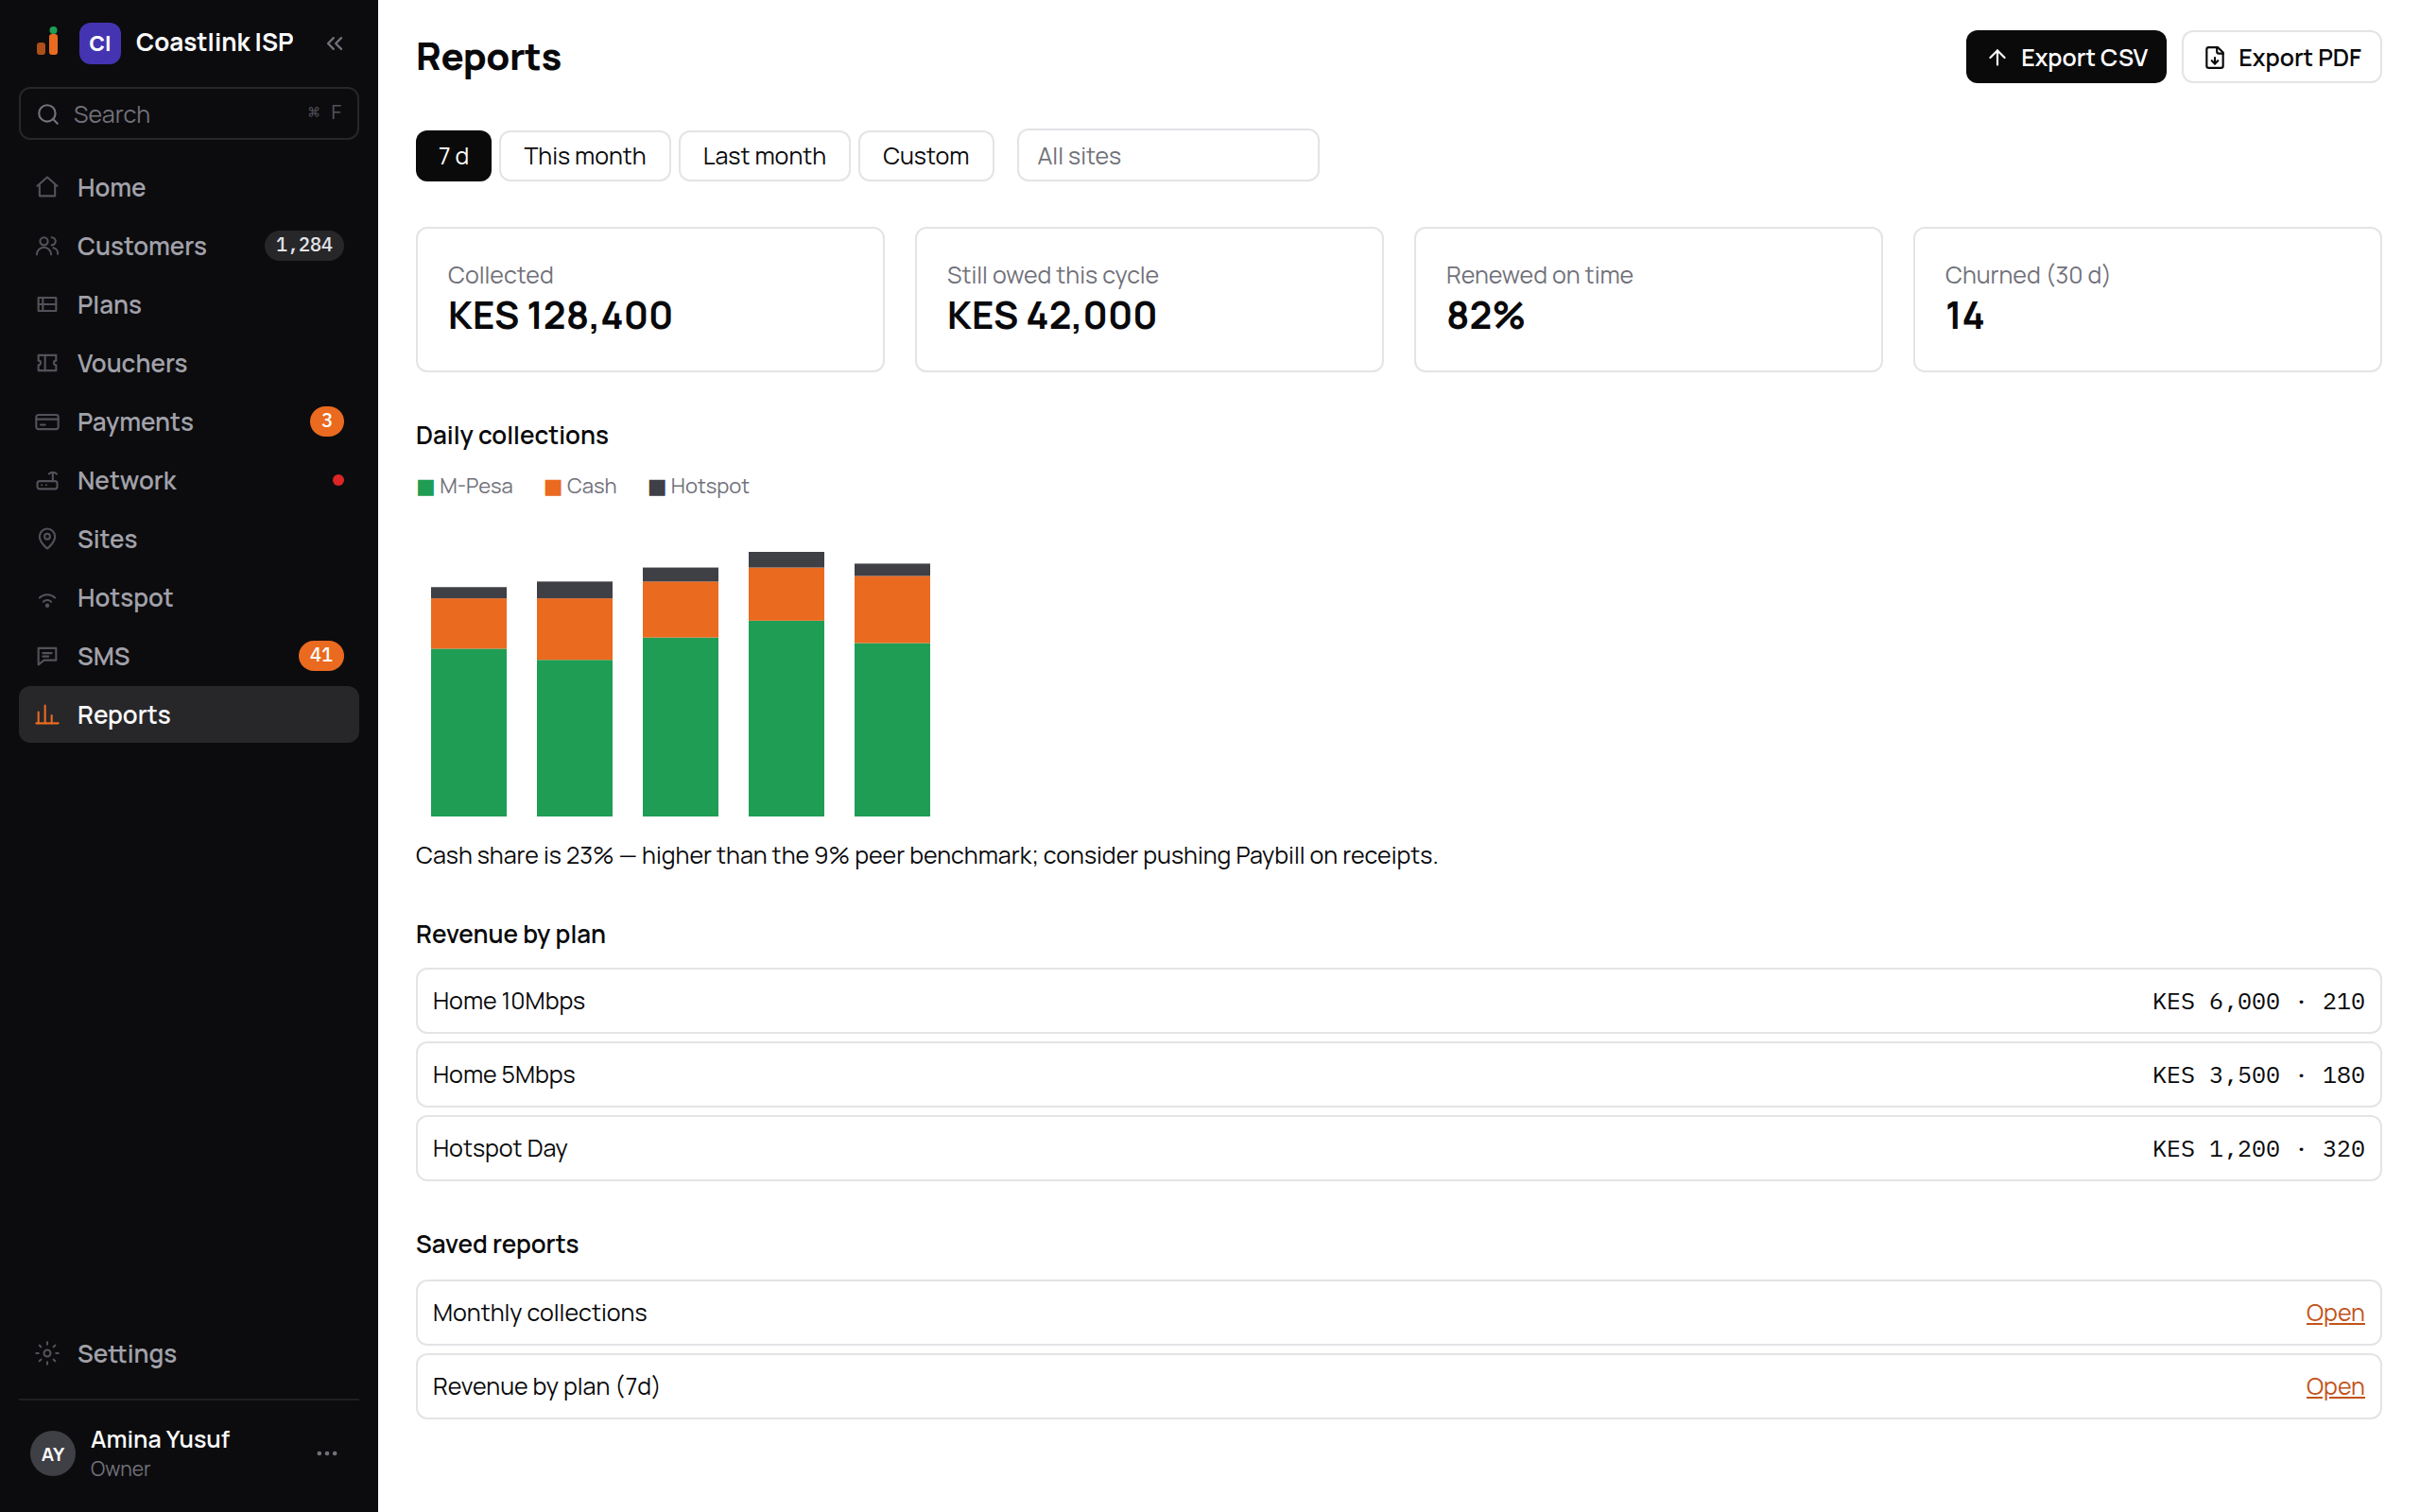
Range and site
The range buttons are 7 d, This month, Last month and Custom. Custom shows From and To date pickers. The Site box ("All sites") narrows every figure to routers at one site; leave it empty for the whole ISP.
All figures use your business's own timezone and currency.
The four tiles
| Tile | Shows |
|---|---|
| Collected | Money received in the range, for example KES 128,400 |
| Still owed this cycle | The value of renewals due in the current cycle that are not paid yet, for example KES 42,000 |
| Renewed on time | The share of subscribers who renewed before their plan ended, as a percentage |
| Churned (30 d) | The number of customers who stopped paying in the last 30 days |
Daily collections
A stacked bar per day, with one colour per payment provider that collected money in the range, named the way the provider names itself, plus Hotspot for hotspot plans whichever provider took the money. Money a gateway brought in on its own (such as M-Pesa or Paystack) is green; money a cashier recorded (Cash) is orange; Hotspot is grey. The legend above the chart lists exactly the providers in the bars, largest first, so a business on M-Pesa and cash sees M-Pesa · Cash · Hotspot and a business on Paystack sees Paystack · Hotspot.
Days are your business's own calendar days, in the timezone set for your business. A payment at 01:30 in the morning counts for that day, not the day before.
Below the chart is a hint line that reads your mix, for example "M-Pesa is 70% of collections; cash 25%, hotspot 5%." When cash is well above the peer benchmark it says so instead: "Cash share is 23%, higher than the 9% peer benchmark; consider pushing M-Pesa on receipts."
A high cash share usually means cashiers are recording cash that customers could pay in directly. Printing your business number (for example your M-Pesa Paybill) and the customer's account number on receipts moves it.
Empty state: "No collections in this range. Pick a wider range or check back after payments settle."
Revenue by plan
One row per plan with the revenue collected in the range and the number of paying subscribers, for example Home 10Mbps and KES 6,000 · 210. Hotspot plans appear here too, so a busy hotspot shows many small payments against one plan.
Saved reports
Reports saved earlier appear here, for example "Monthly collections" and "Revenue by plan (7d)", each with an Open button. Opening one re-runs it on today's data. Empty state: "No saved reports. Save a report to re-run it later."
Exporting
Two export buttons sit in the header. Export CSV (the primary action) downloads the current range and site as a spreadsheet, one row per day and payment method (date, method, providerKey, amountCents, currency, amounts in the currency's smallest unit); "CSV export ready." confirms it and the file lands in your browser's downloads. Export PDF downloads the same report as a PDF for printing or sending. Both need the financial-reports permission, so a Support user sees the figures but cannot export.
A weekly routine
Monday: last week's money
Pick 7 d, leave Site empty. Read Collected against your payment provider's statement and the cash drawer. Open Payments and clear the Unmatched queue before you trust the number.
Check the cash share
Read the hint line under Daily collections. If cash is climbing, remind cashiers to offer your business number and make sure the receipt SMS carries it.
Look at renewals
Renewed on time below your usual figure means reminders are not landing or a site was down. Cross-check with the SMS Outbox (failed reminders) and the Routers screen (a down router blocks renewals at that site).
Follow up churn
Churned (30 d) counts customers who stopped paying. The Customers screen's expired chip shows the same people so support can call them.
Export for the accountant
Click Export CSV or Export PDF with Last month selected on the first working day of the month.
Per-site figures
Pick a site in Site to limit every tile and chart to routers assigned to that site. Use it to compare an outage's effect ("Renewed on time" at Kilimani versus the rest) or to see which site a new plan sells at. Sites are created under Sites and routers are assigned to them from the router header.
Reconciling with M-Pesa
Compare Collected against your M-Pesa statement for the same days. A gap is usually money sitting in the Unmatched queue. Match it and the tile catches up.